East Bench Community Council
January 19, 2012Pedestrian Safety/Crosswalk Enforcement
January 20, 2012Crime rates are one of my hottest topics. Let’s face it, we all want to know the when and where. With CrimeReports, you can customize exactly that. Now that you’ve learned how to narrow your searches, adjust your maps and set time limits, let’s see what information that can produce.
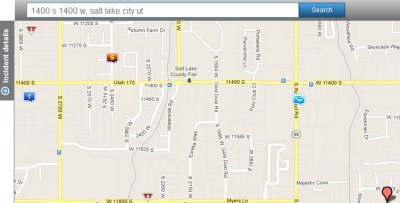
Starting on the main search page, look to the left edge and you’ll see a tab labeled ‘incident details’ with a + button:
Click on the plus sign and it will bring up a submenu:
Now click on the the orange ‘Trends” button and you get a graphic representation of the crime stats in three different forms:
Now if you click on the + button to the right of each graph, it will pull it up in detail. You can explore from there by hovering your cursor over a line, bar, or section. Note that you can print this dropdown box by clicking on ‘view/print’ in the upper left corner. To go back to the main menu, click on the orange “details” button.
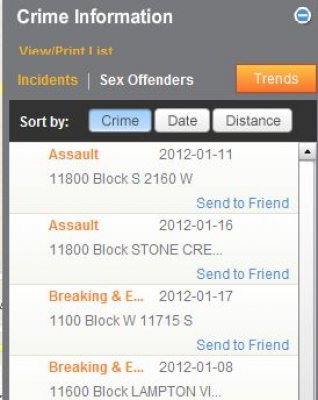
Now, for a minute click on the ‘crimes’ button, and you’ll see a list show in the viewing pane. Let’s say you were talking to a neighbor about something that you heard about and noticed on this list a possible match to the situation. You can send it to your friends! Just click on the ‘send to friend’ next to the incident detail and fill in the information.
I hope these lessons have been helpful, because I believe that CrimeReports is one of the most useful tools you have at your fingertips to learn more about just what is happening in your neighborhood.
What’s next: How to submit a tip about a crime using CrimeReports.


